To access the Summary screen click on the Summary tab in the menu bar as follows:
![]()
This will load the summary sceen as shown below:
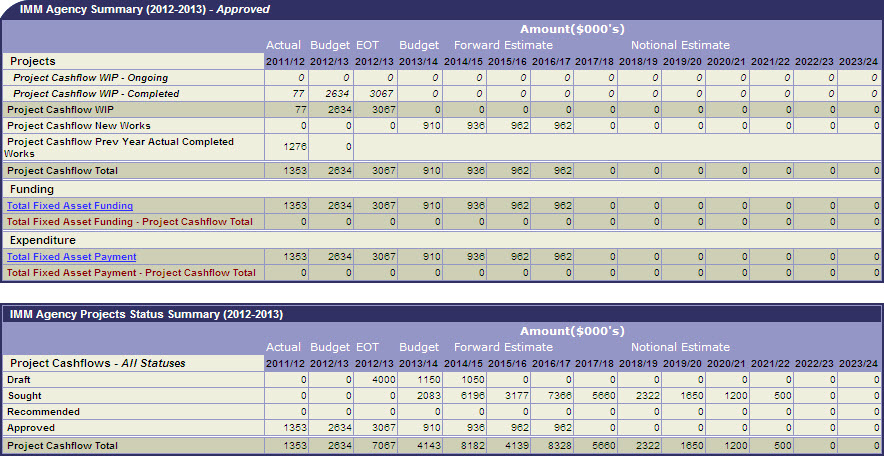
Under the 'Projects' heading in the table all of the currently approved projects are broken down into various categories and then a total figure is provided across the years. For example you are able to view the project cashflow totals by Works in Progress (WIP) - Ongoing, Works in Progress - Completed, Total Works in Progress, New Works and Previous Year Completed Works. Each category has a different row with the total project cashflow for each row spread across the columns for each financial year. The last row in the 'Projects' section of the Summary Table is a Project Cashflow total for each of the years shown on screen.
The Funding
row provides a total for each year of all funding sources. The Funding
table
can be accessed from the Summary table through the menu system or by clicking
on ![]() . The
row under the Total Funding Sources row reconciles the total funding
sources figure with the total project cashflow figure for each corresponding
financial year. If the figures reconcile there will be a zero in this row,
however if the figures do not reconcile the amount of the variance will
be
in this row and highlighted in red as shown below;
. The
row under the Total Funding Sources row reconciles the total funding
sources figure with the total project cashflow figure for each corresponding
financial year. If the figures reconcile there will be a zero in this row,
however if the figures do not reconcile the amount of the variance will
be
in this row and highlighted in red as shown below;
![]()
This indicates that either the total funding figure or the total project cashflow figure is out for that year and one needs to be adjusted to reconcile with the other.
Under the Funding section of the table is the Expenditure section of the table as follows:

The
Expendiure section of the table reconciles the total project cashflow figure
with the total payment (expenditure) figure as reflected in the BTM Fixed
Asset Payment table in the IMM. This table can be accessed through the
menu
system
or
by clicking on the ![]() link. If there is a variance between the total project cashflows and the
total payment (expenditure) figure it will be highlighted in red to indicate
the figures need
adjusting.
link. If there is a variance between the total project cashflows and the
total payment (expenditure) figure it will be highlighted in red to indicate
the figures need
adjusting.
The second table in this screen is the IMM Agency Projects Status Summary table shown below:
This table breaks up the total project cashflow for each financial year down into the various statuses that each project is sitting in. Depending on what project is in what particular status the total project cashflow will be spread across Draft, Sought, Recommended and Approved.
Updated 18 June 2013